See Where Cases Stall And Who Owns the Work
Cases move across teams and vendors, with SLA clocks ticking. See where cases stall, who owns the work, how workload is distributed, and which cases need attention, so your team can prioritize and follow up.
Built for health plans and the clinical operations teams running them.
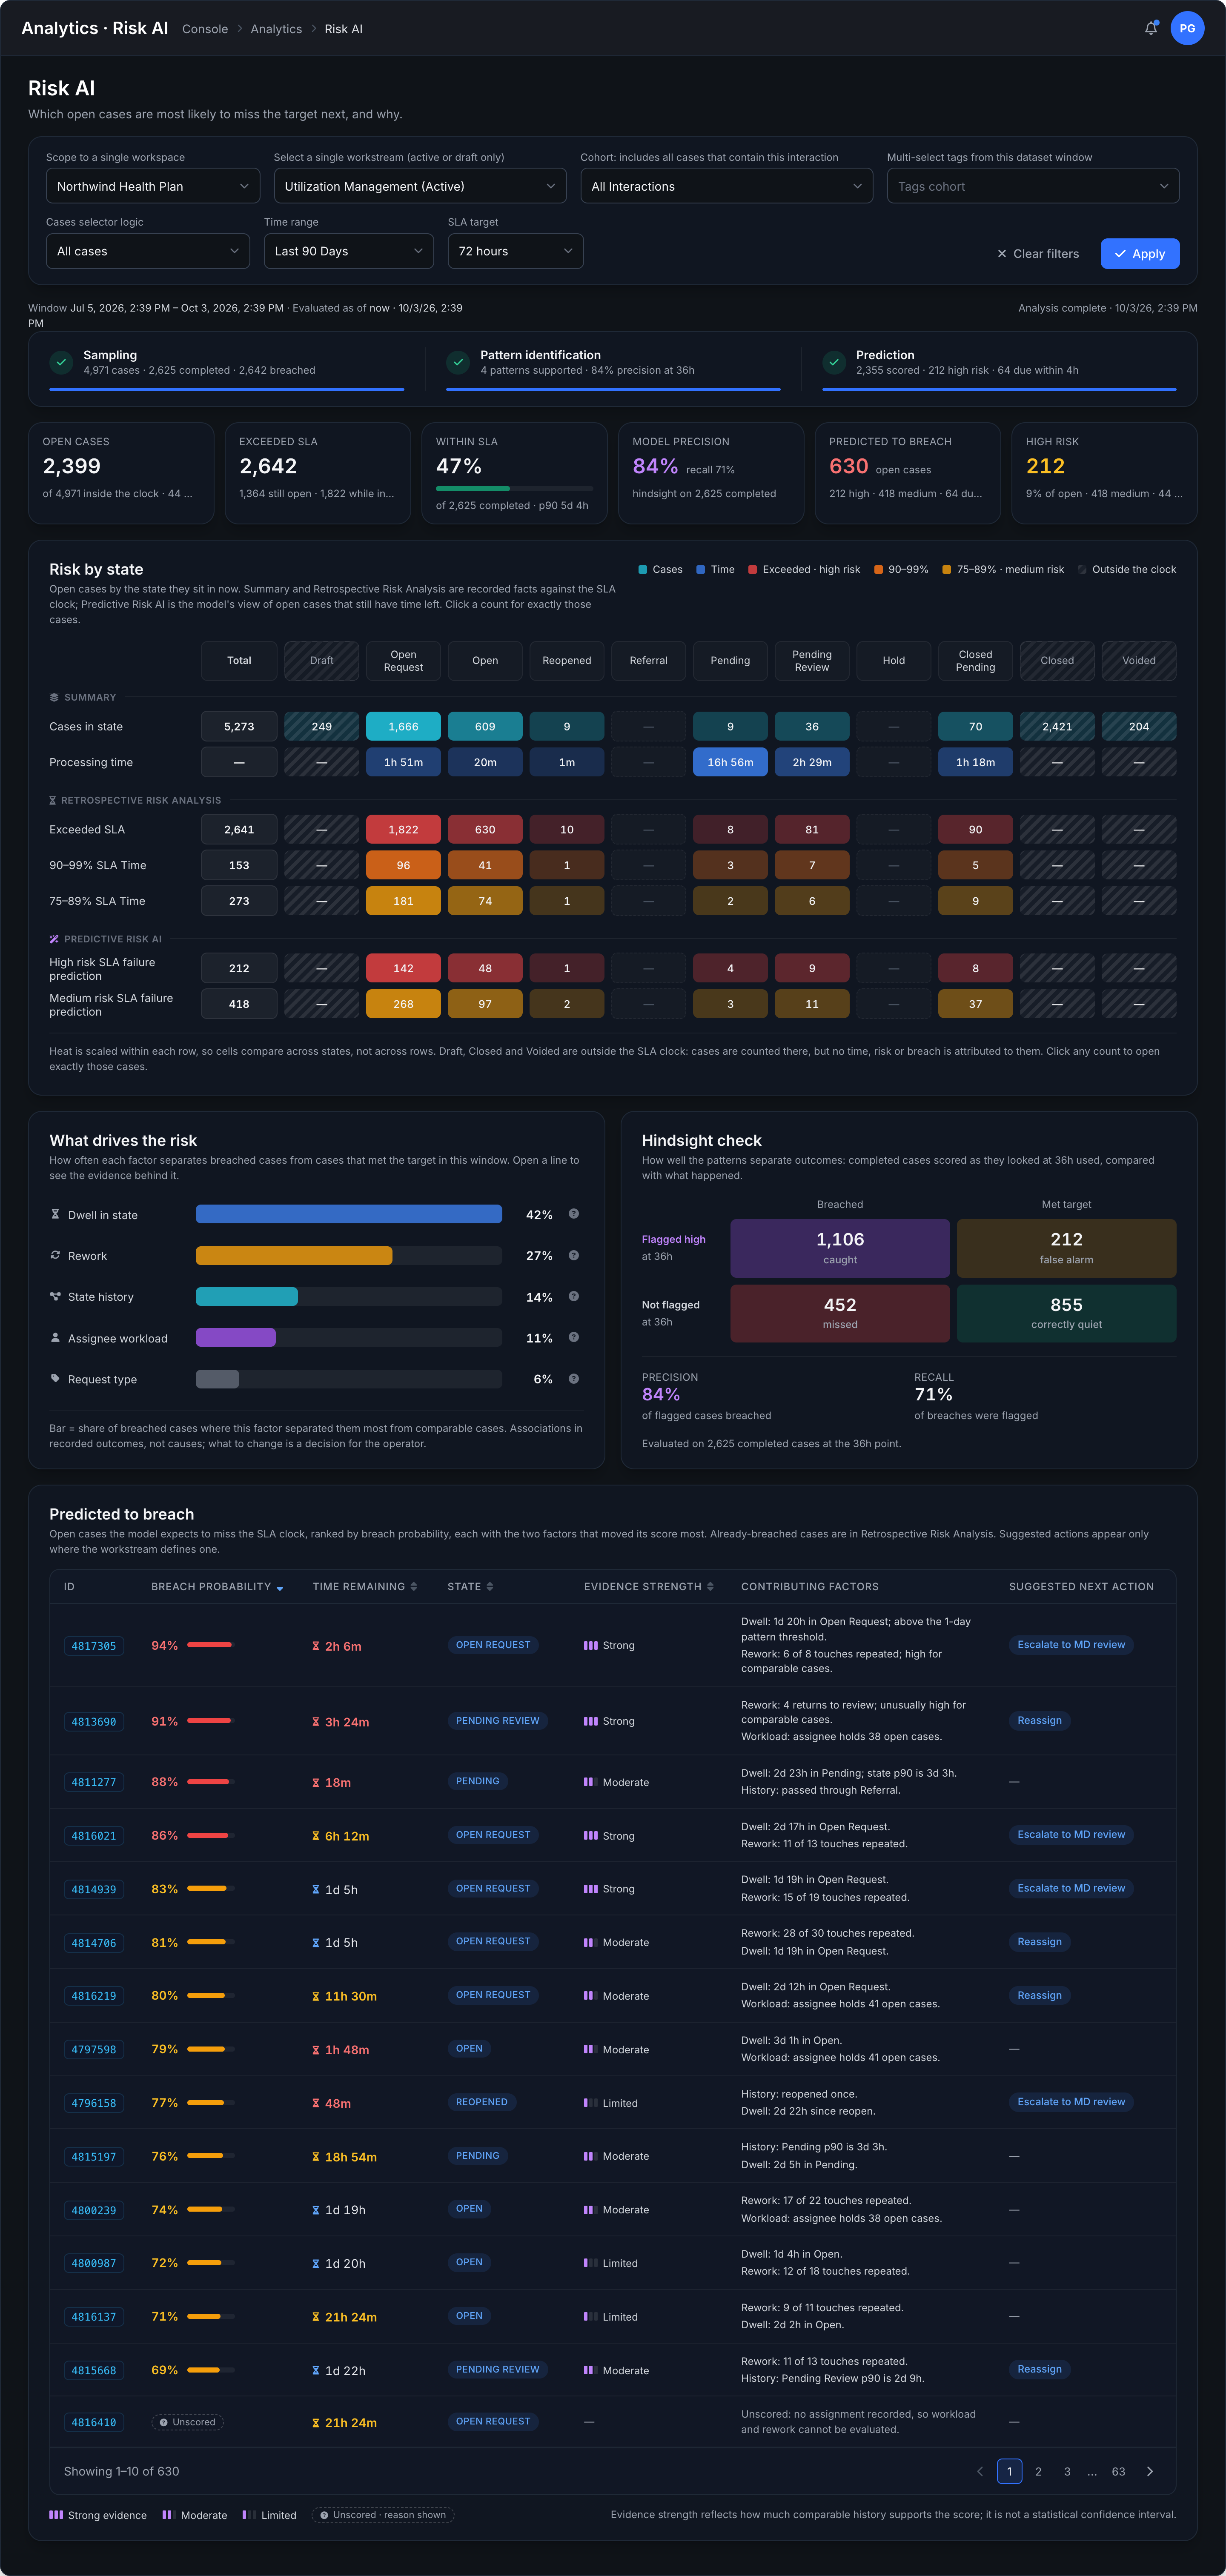
Risk AI preview, by case state (Draft, Submitted, Pending, Review, Letters and Closed): open cases, predicted to breach and cases at risk.
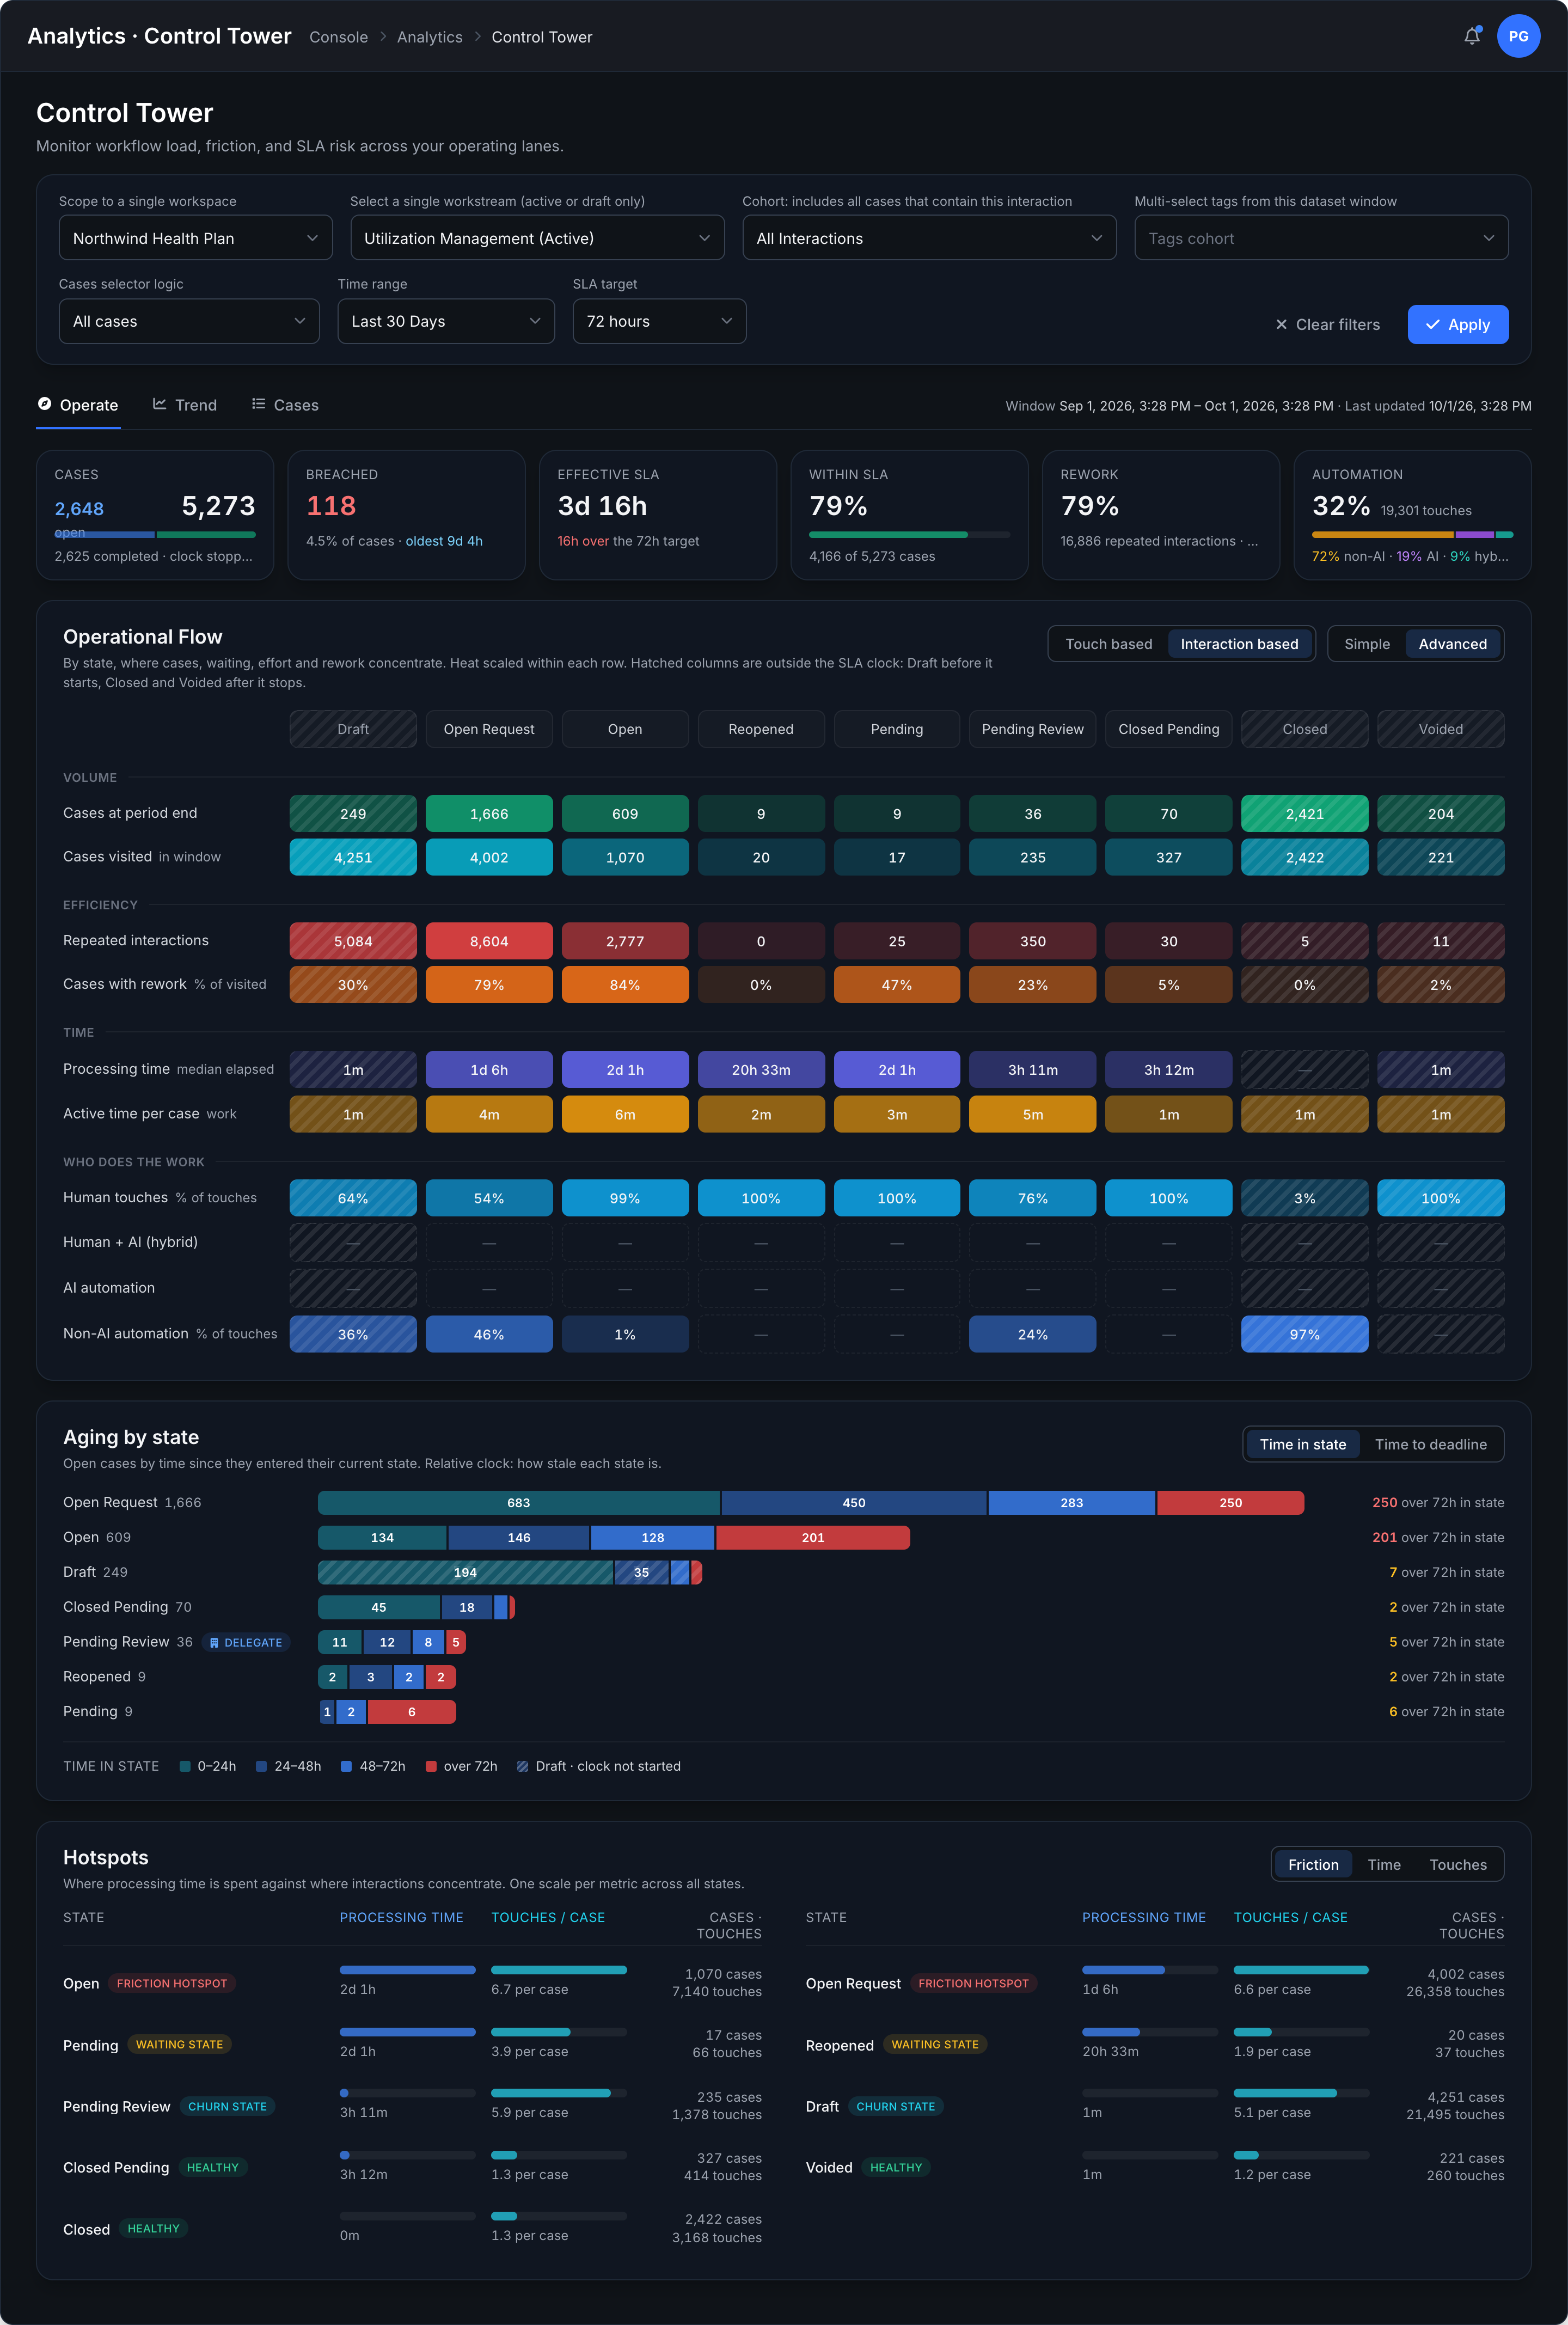
Find Friction Before It Finds You
The Control Tower surfaces where cases stall, which stages consume the most time, where rework concentrates, and which SLAs need attention.
See Whether the Backlog Is Growing
Compare incoming and completed cases, then open the days driving the change.
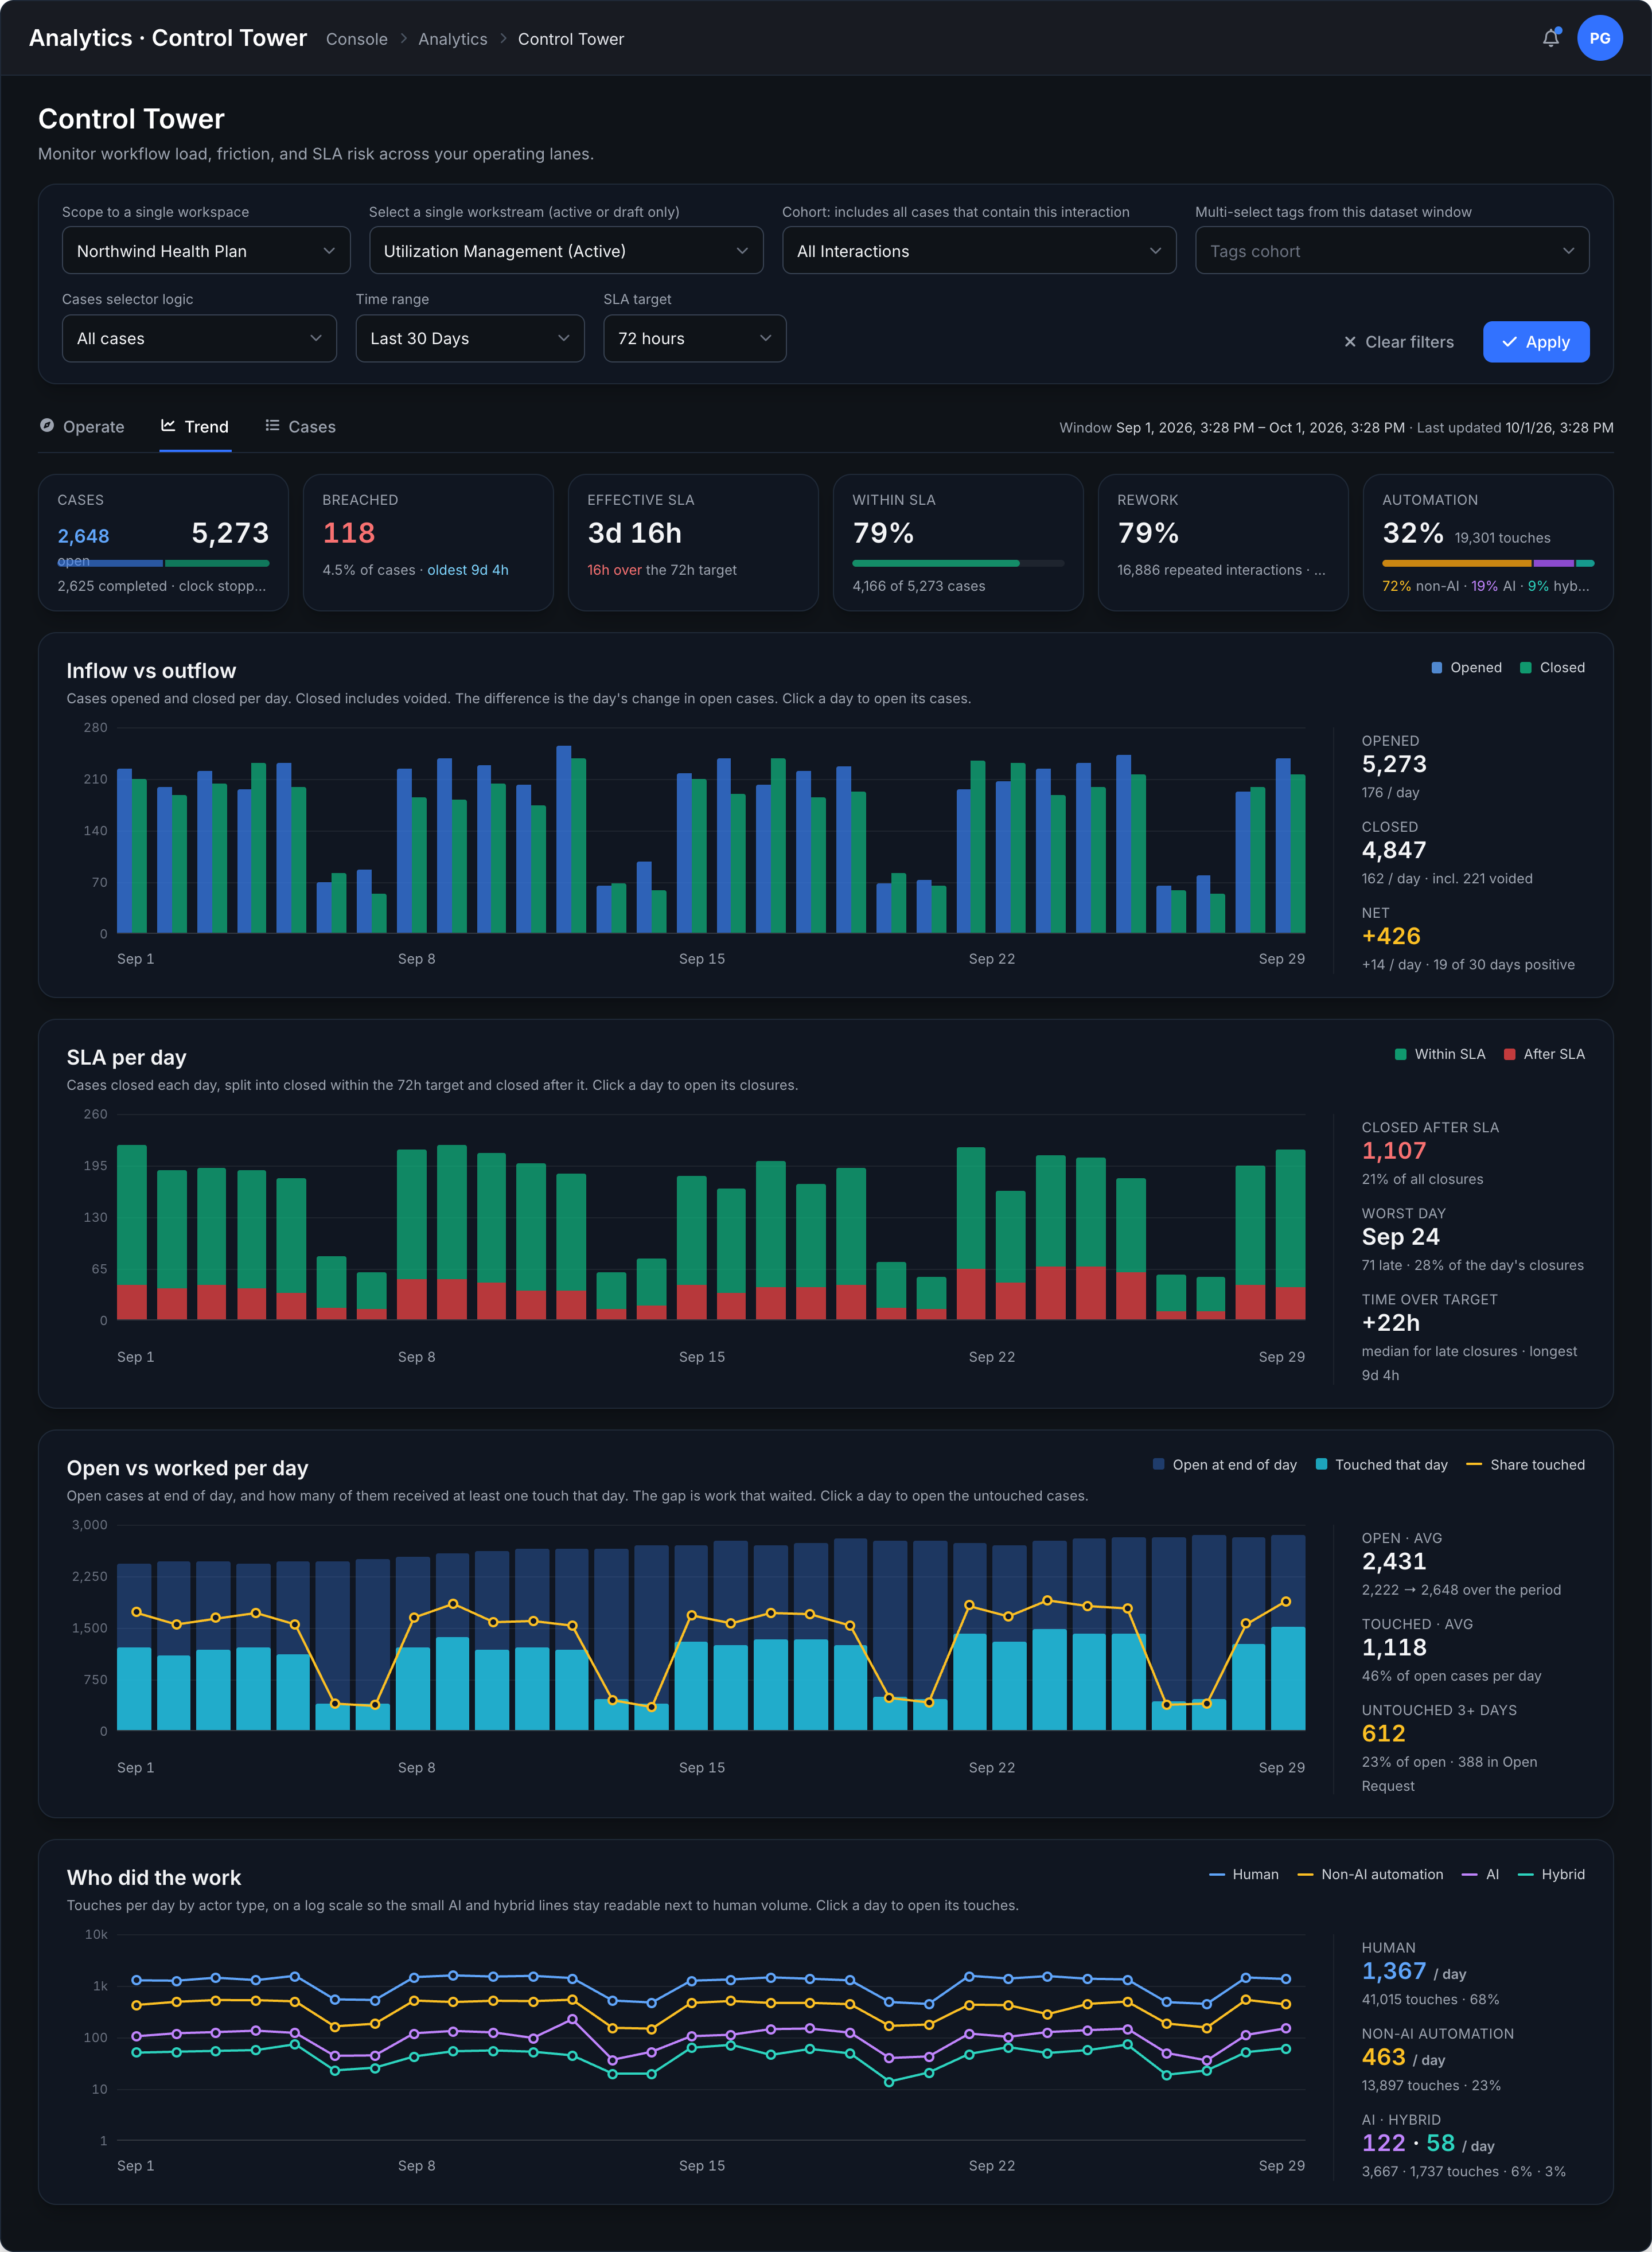
Find the Work That Isn’t Moving
See which open cases received no recorded touch and where follow-up may be needed.
Trace the Loops. Quantify the Rework.
See which interactions repeat, where cases return, and how much effort repeat work represents. Use time-study baselines and case history to focus operational improvements.
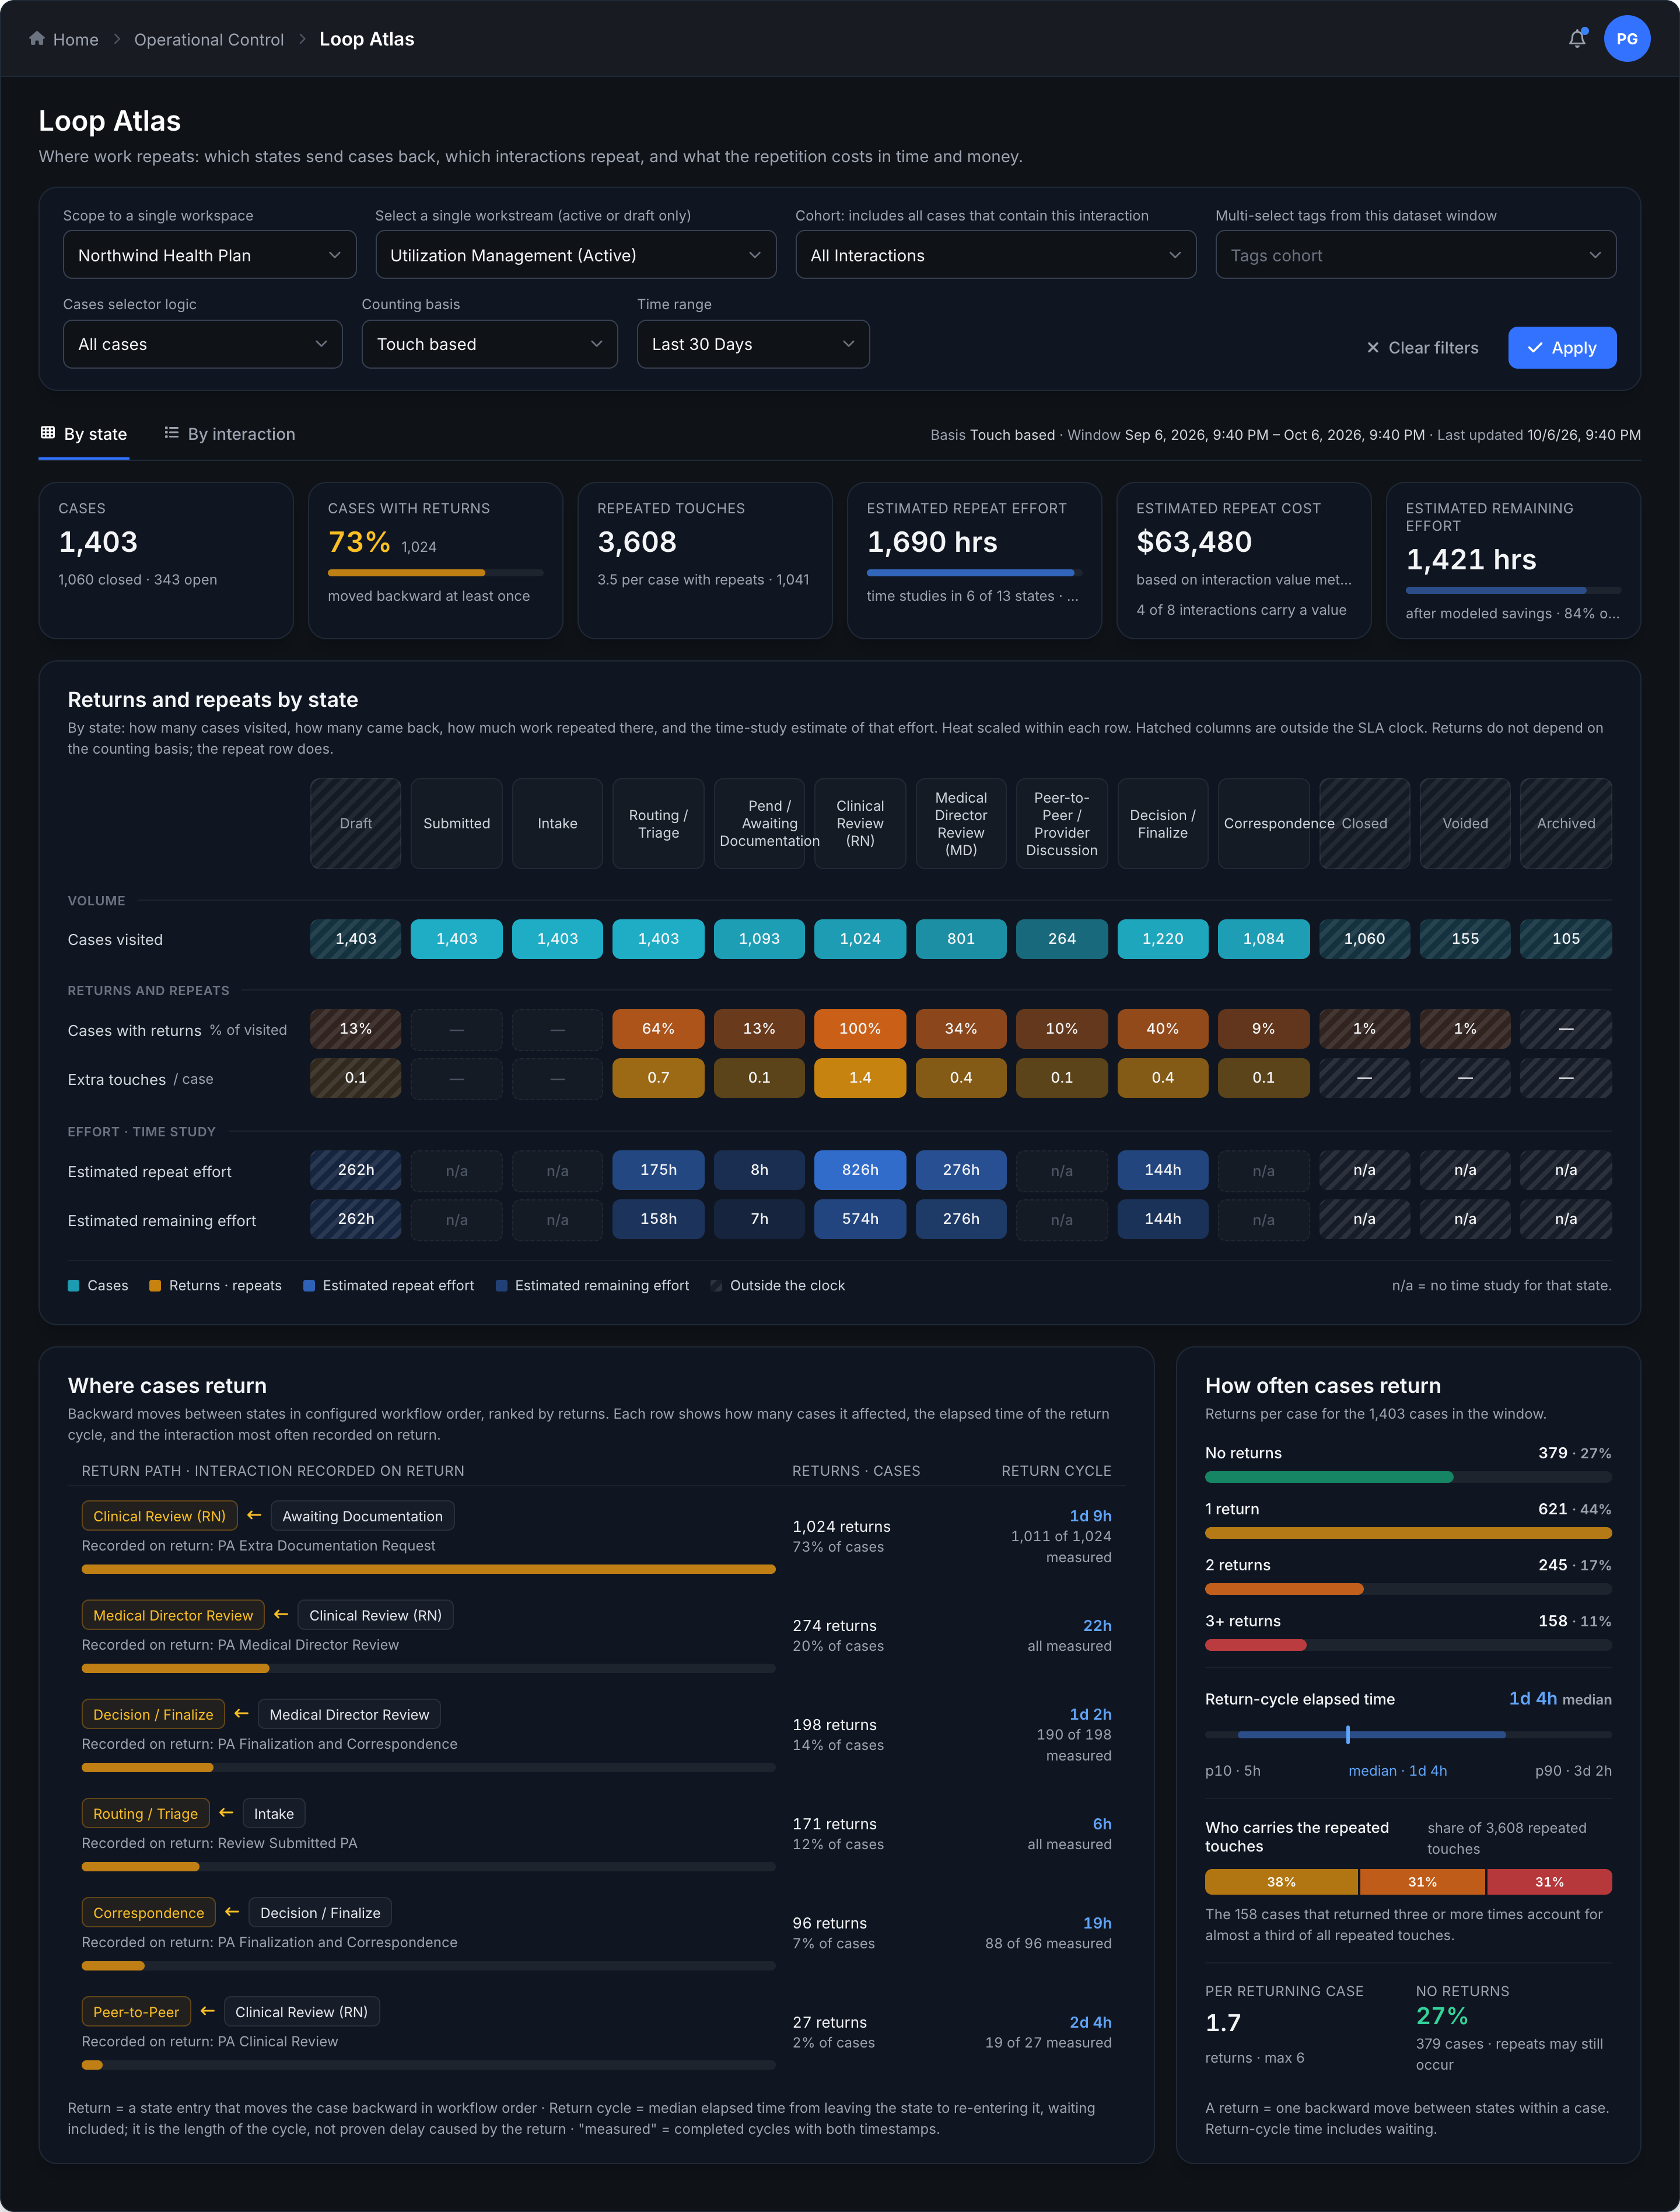
Find Where Cases Return
See which workflow stages cases return to, how frequently they return, and where return cycles consume time.
See Which Repeated Work Carries the Burden
Compare repeated interactions by frequency and estimated effort. Connect time-study estimates and interaction values to the work worth investigating.
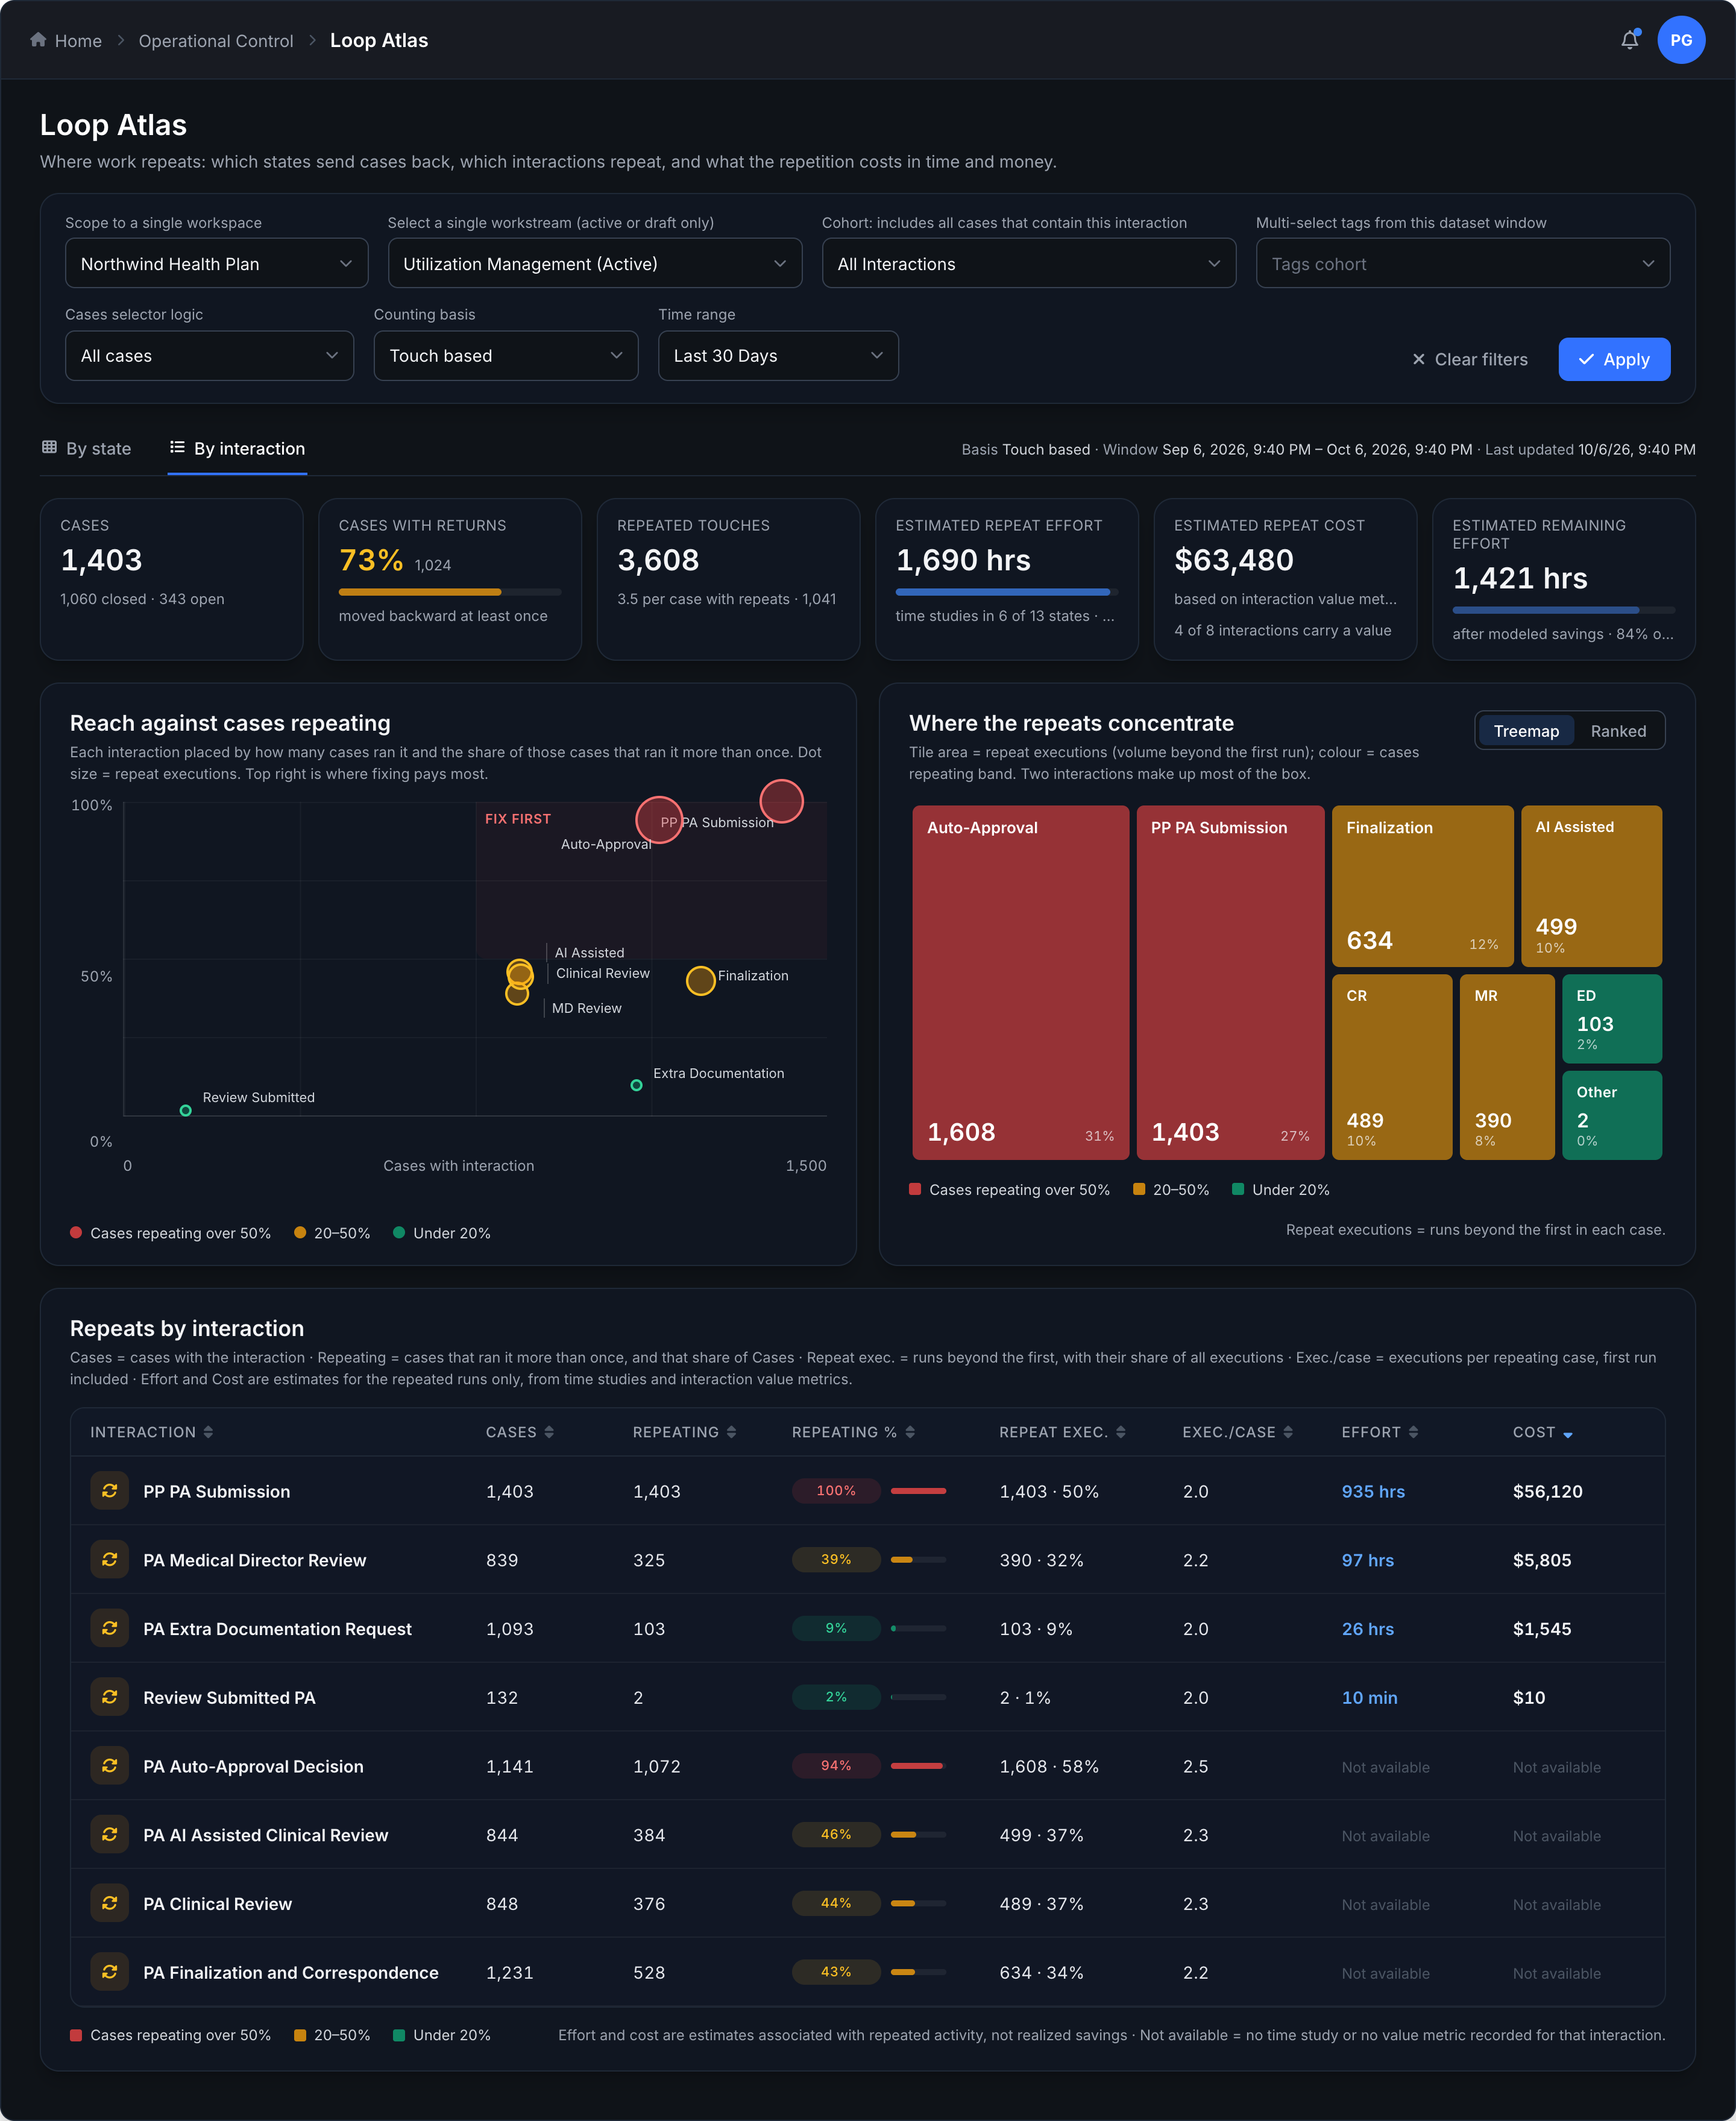
Loop Rate & Repetitions
Identify which interactions repeat most often and how many times cases cycle through the same work before resolution.
Time Burden
Use observed effort or time-study estimates to understand repeated work and where operational time concentrates.
Modeled Financial Impact
Connect repeated activity to cost models in Workflow Economics to prioritize investigations by modeled financial impact.
Follow the Pattern Into the Case
Loop Atlas identifies the patterns. The shared case record brings the waiting, assignments and repeated steps into view, so your team can investigate what happened.
Find the Cases Behind the Hotspot
Open the affected cases with their state, elapsed time and repeated work in view.
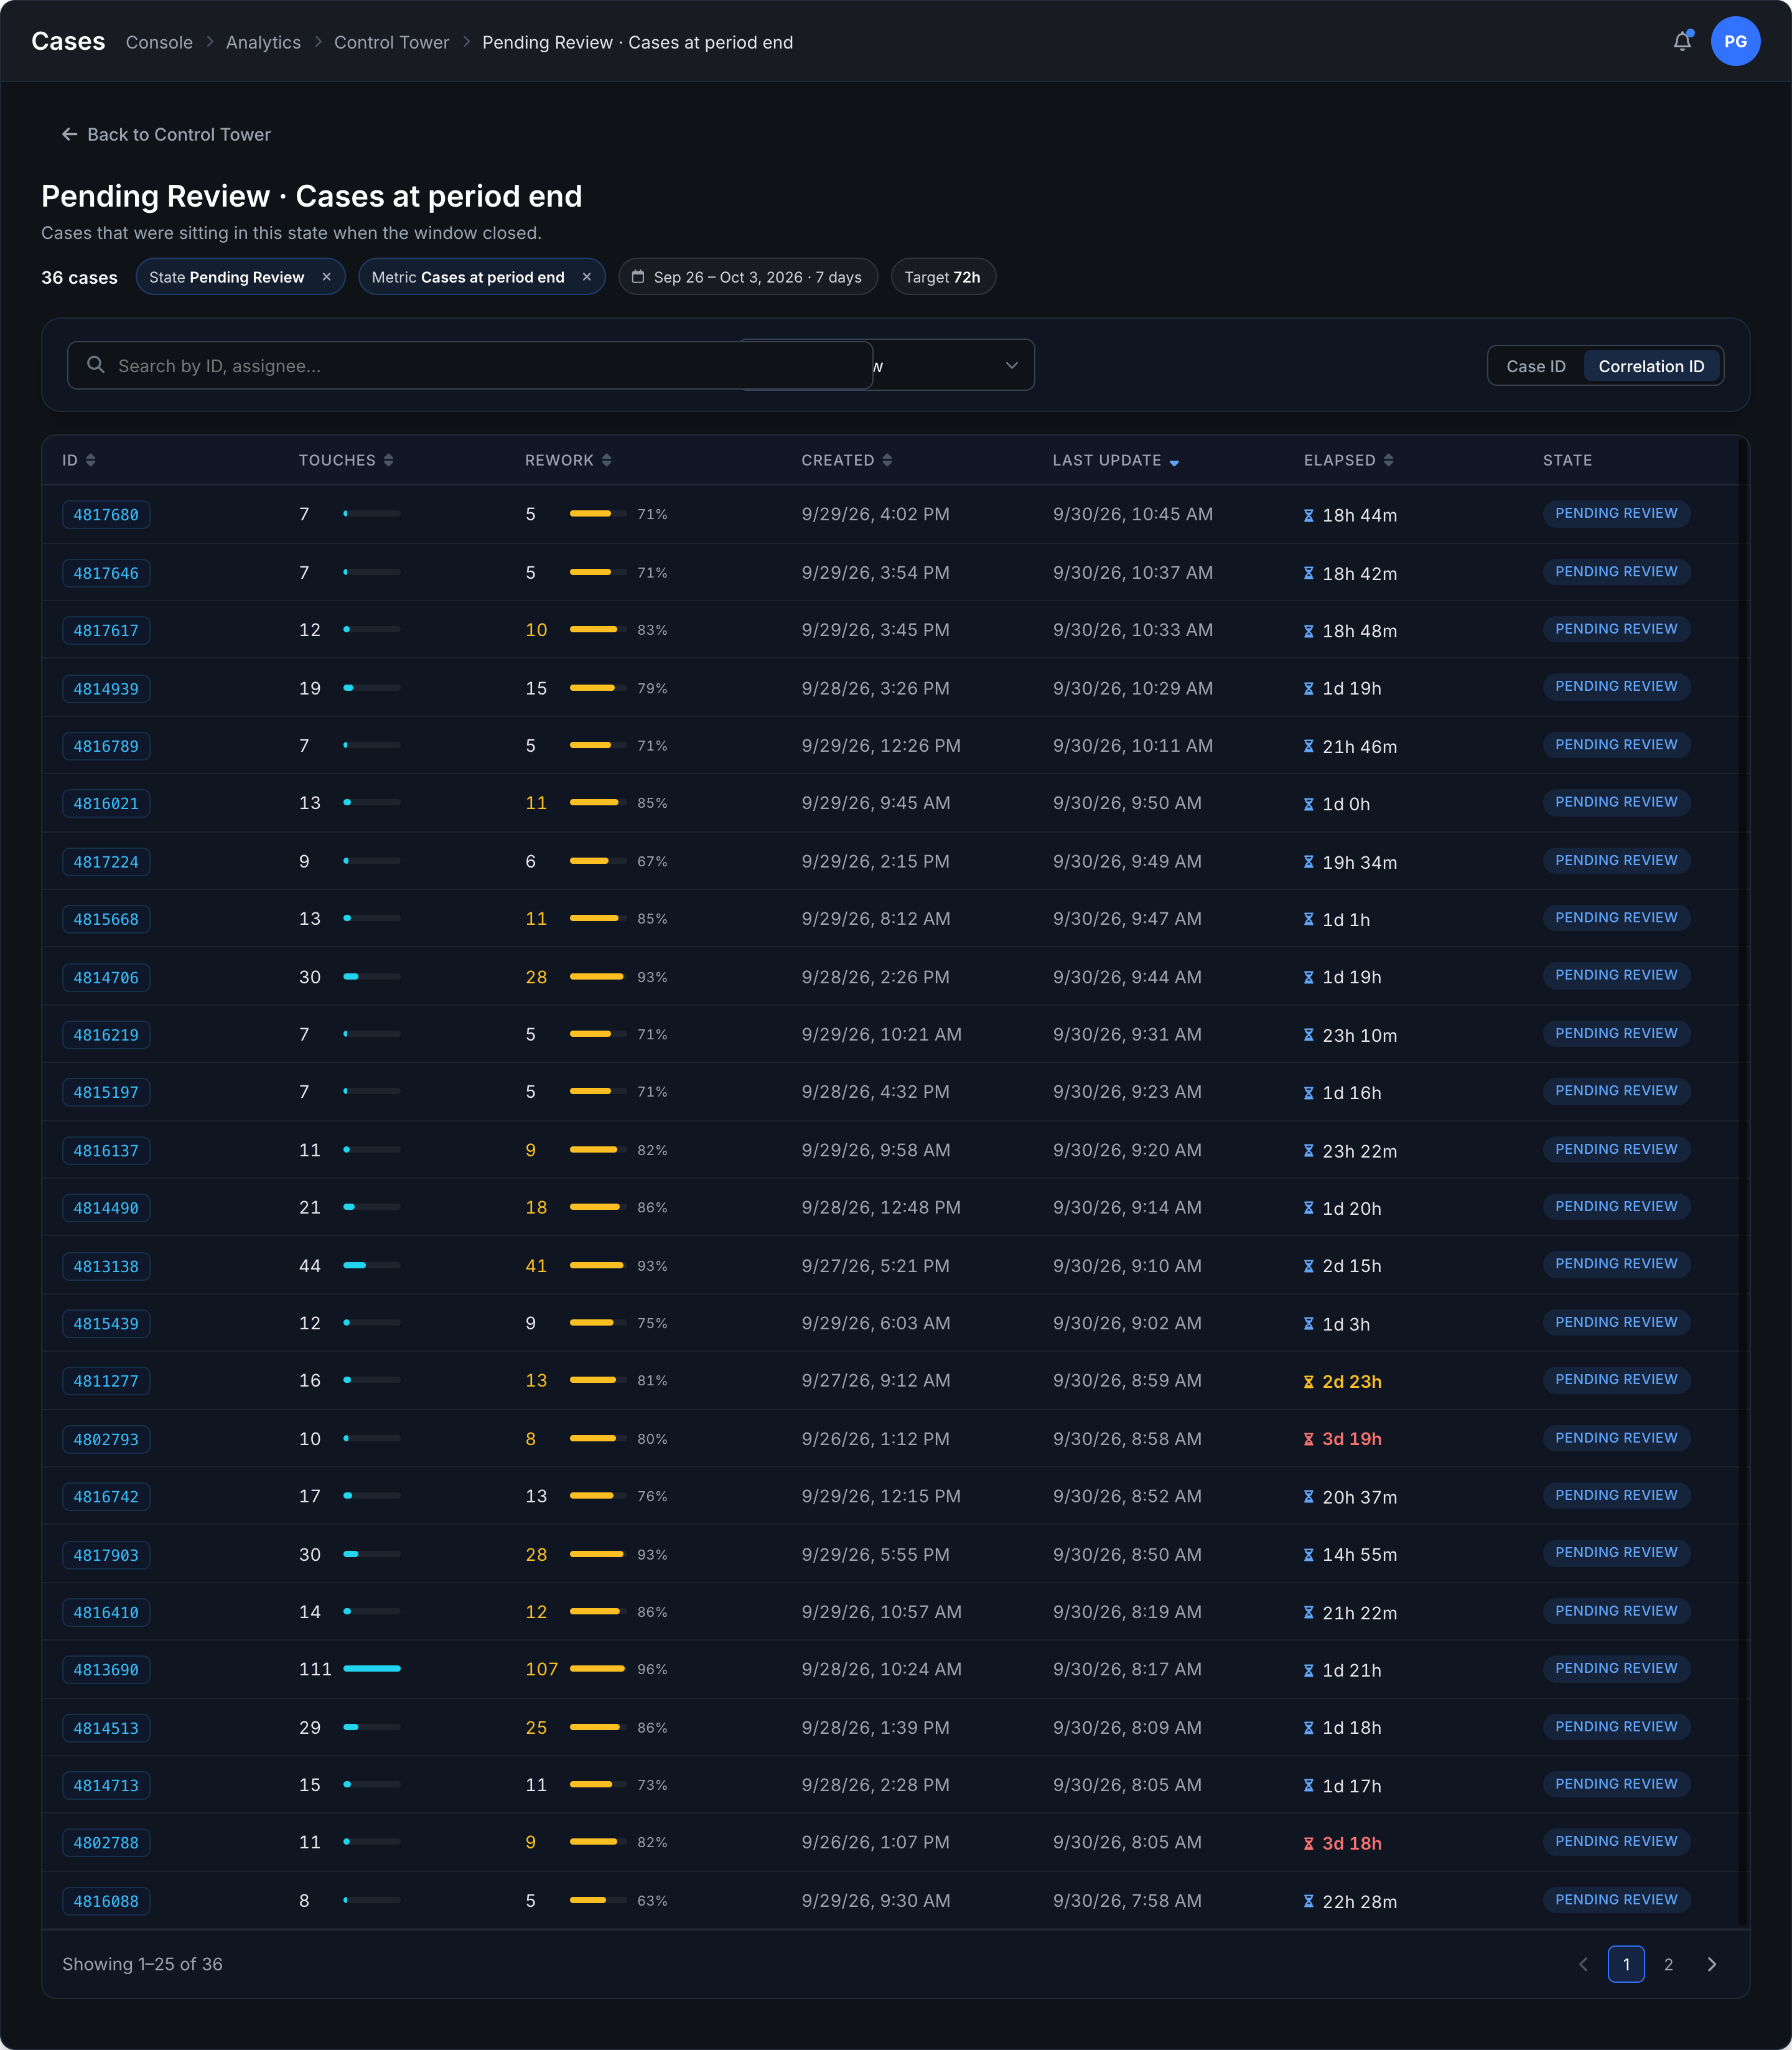
Separate the Work from the Wait
See how much of the case cycle was recorded work and where elapsed time accumulated.
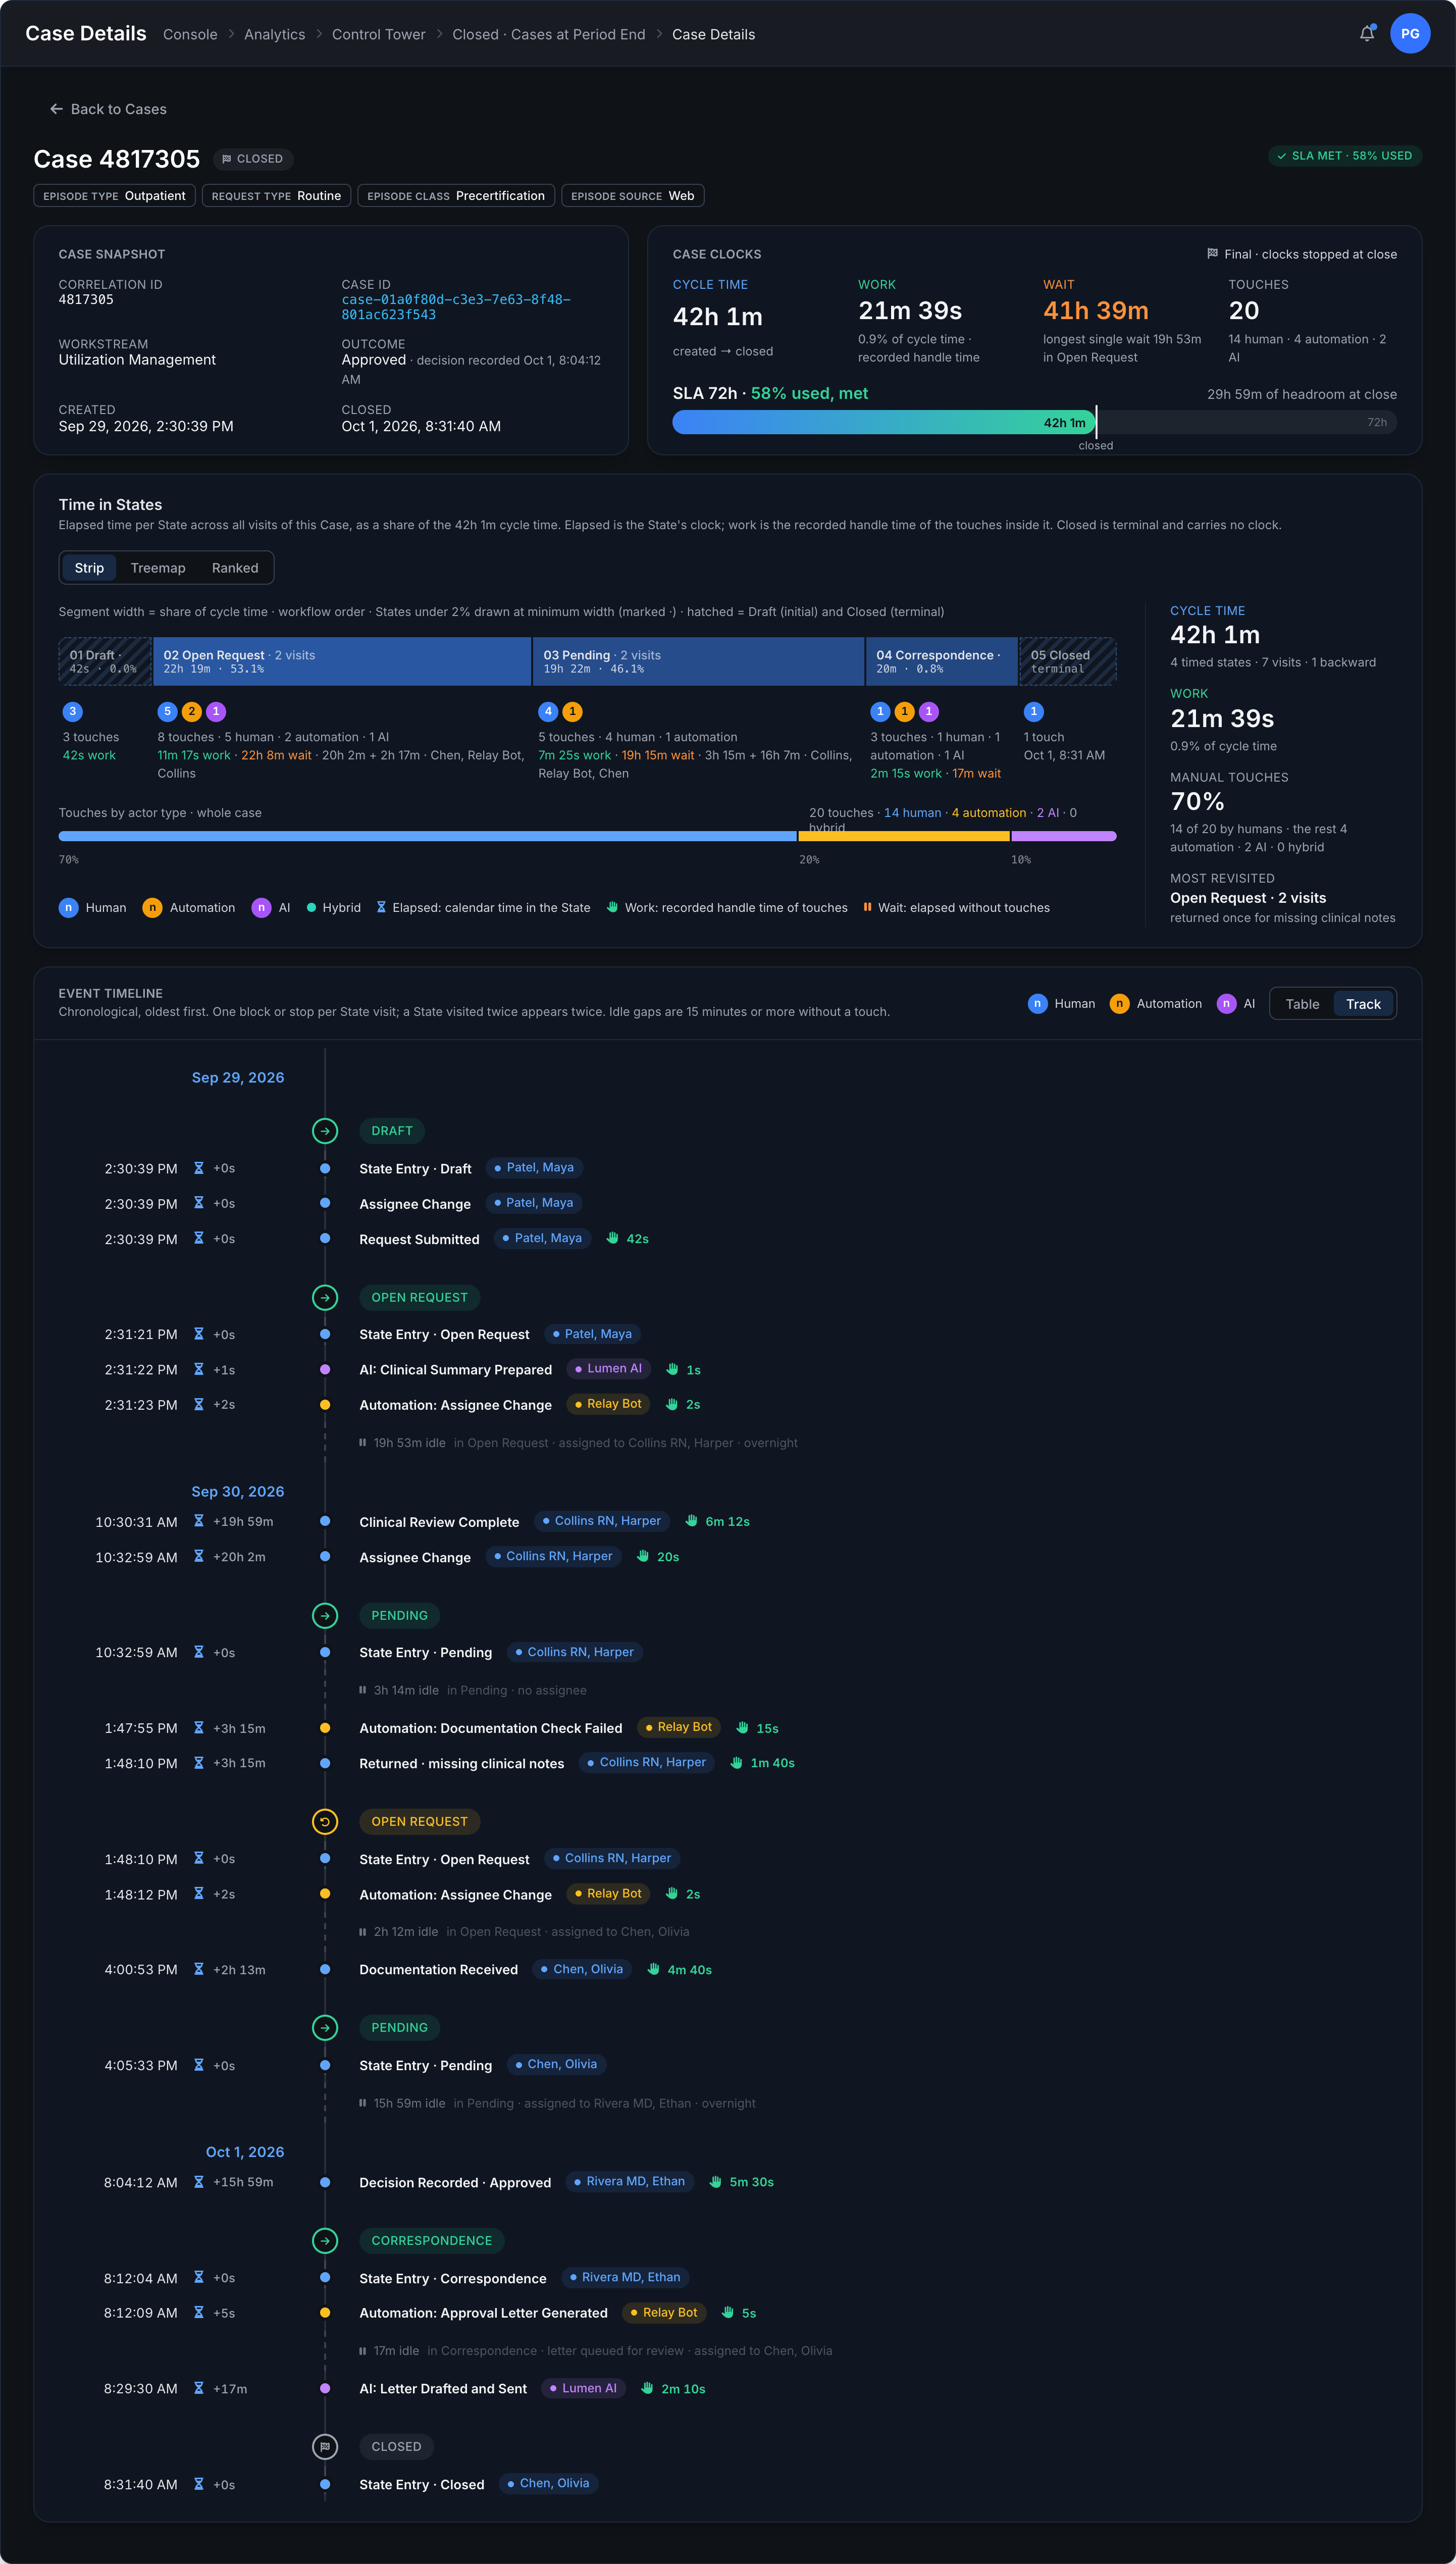
Trace the Handoffs. Understand the Returns.
Follow assignments, interactions and state changes to understand the sequence behind a delay or repeat.
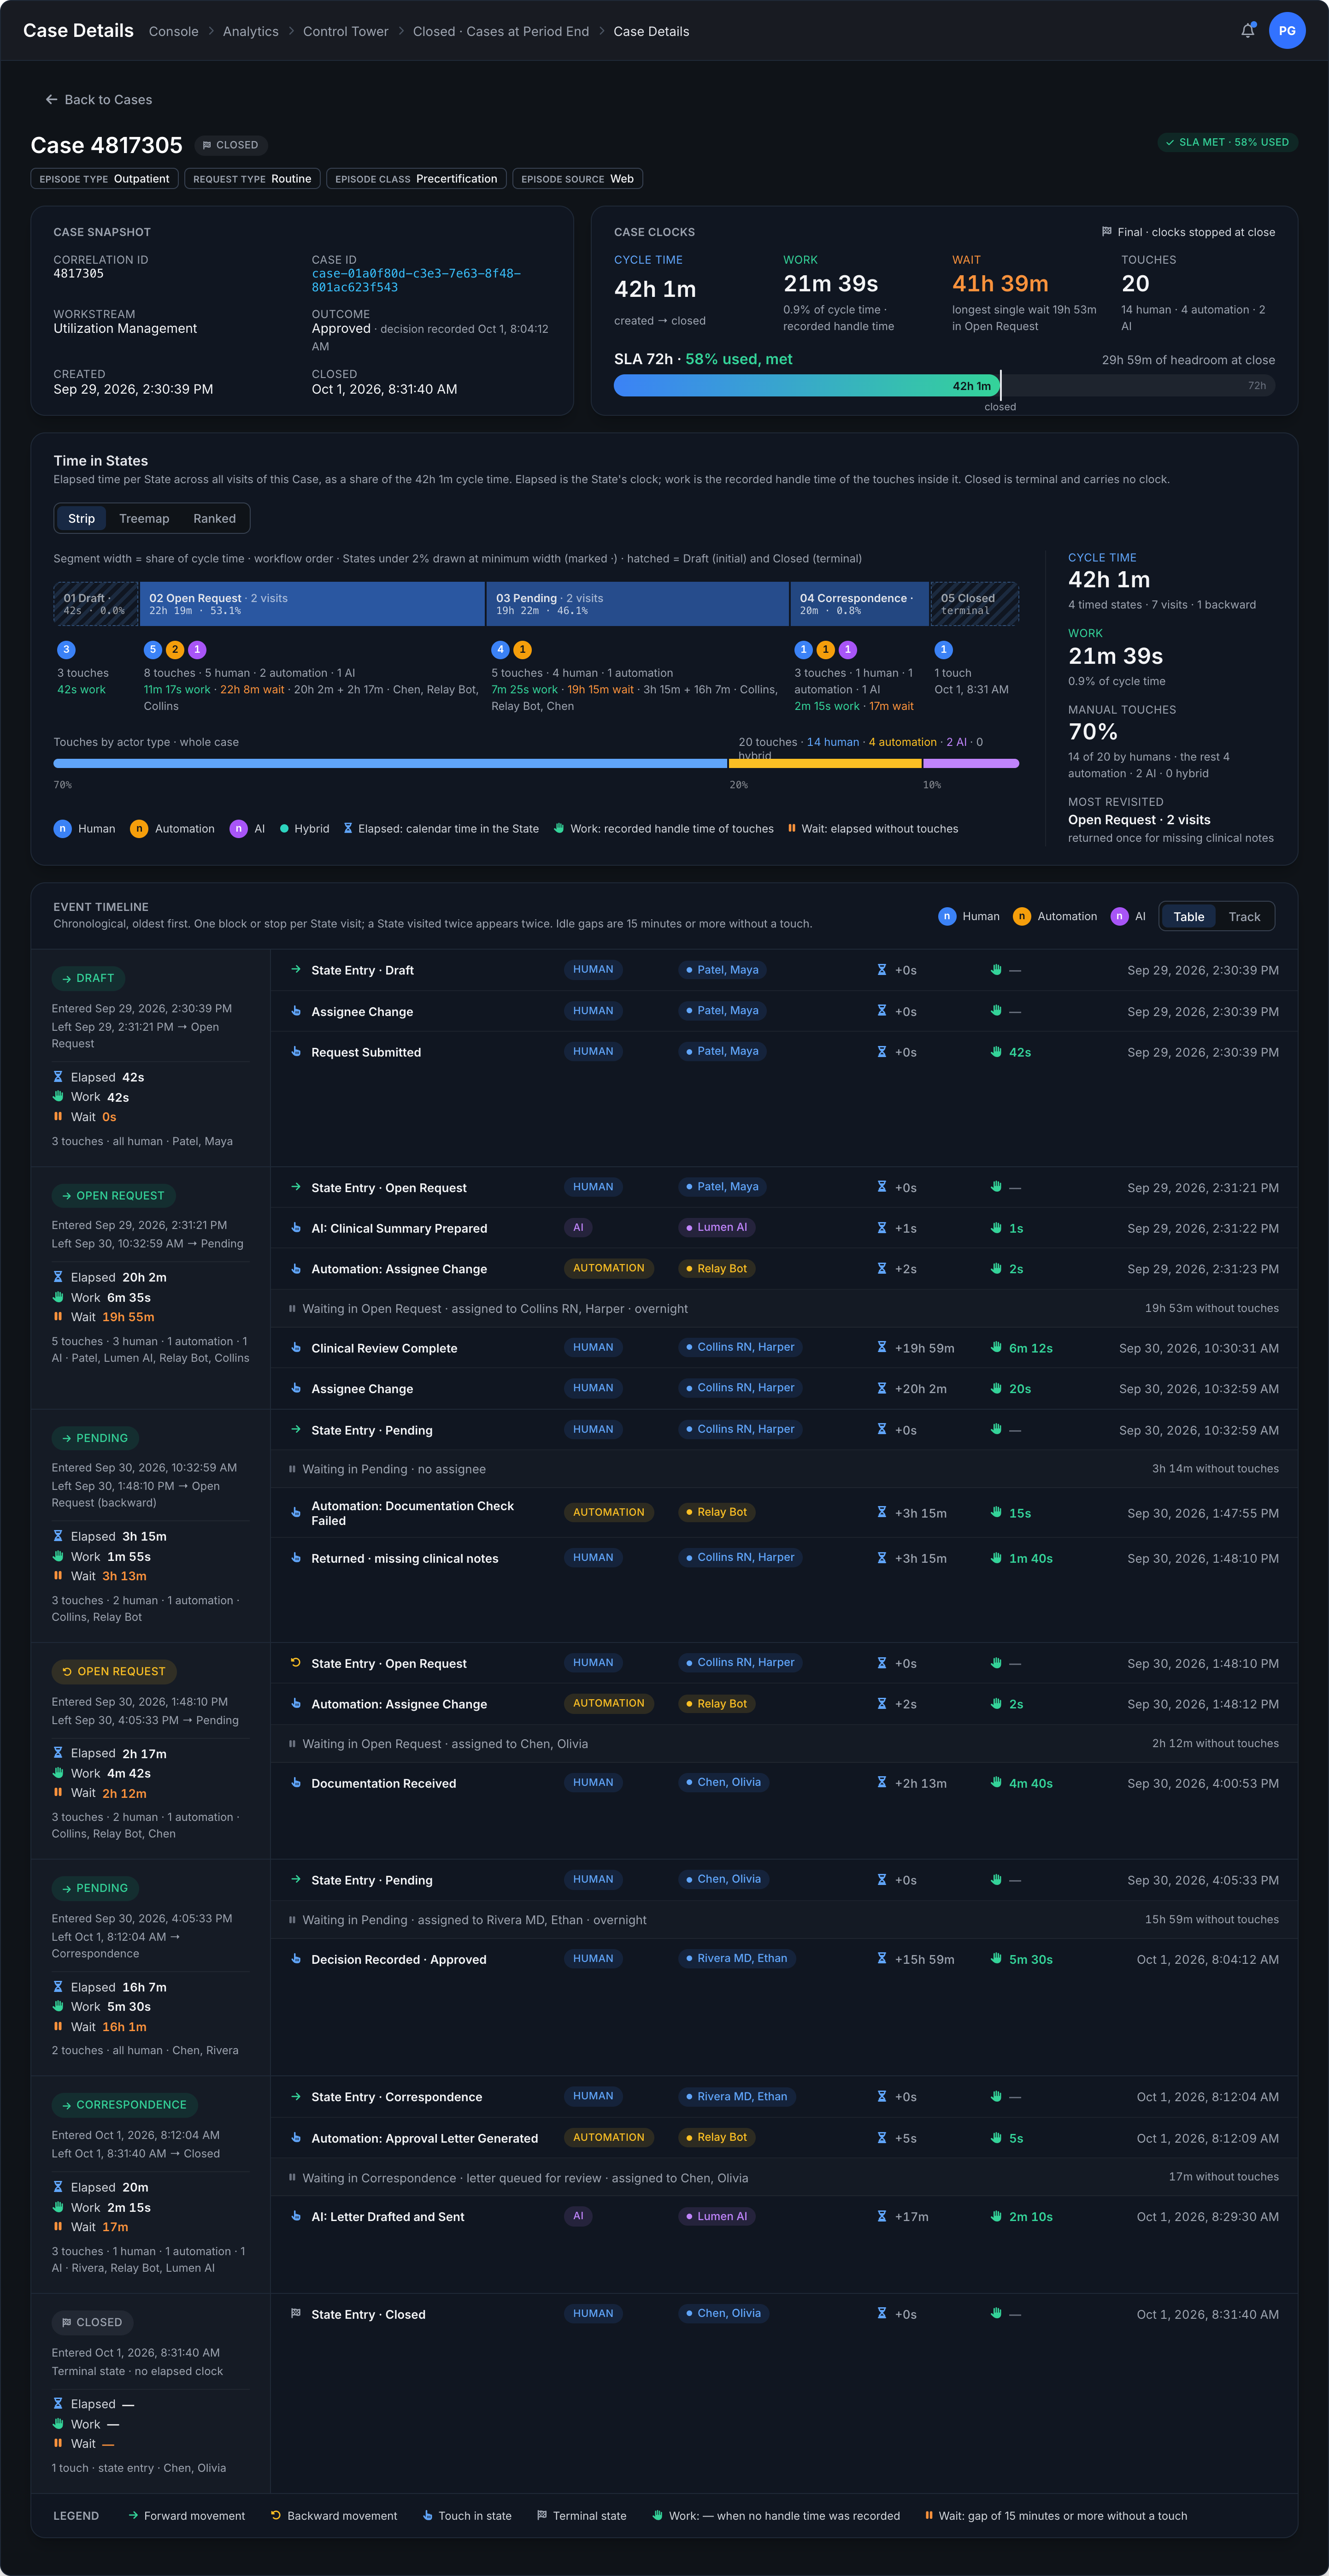
See Every Case, Every Stage, Every Owner
See who owns the work, where ownership is missing, and how activity distributes across your team. Connect assignment coverage, daily workload and pickup patterns in one place.
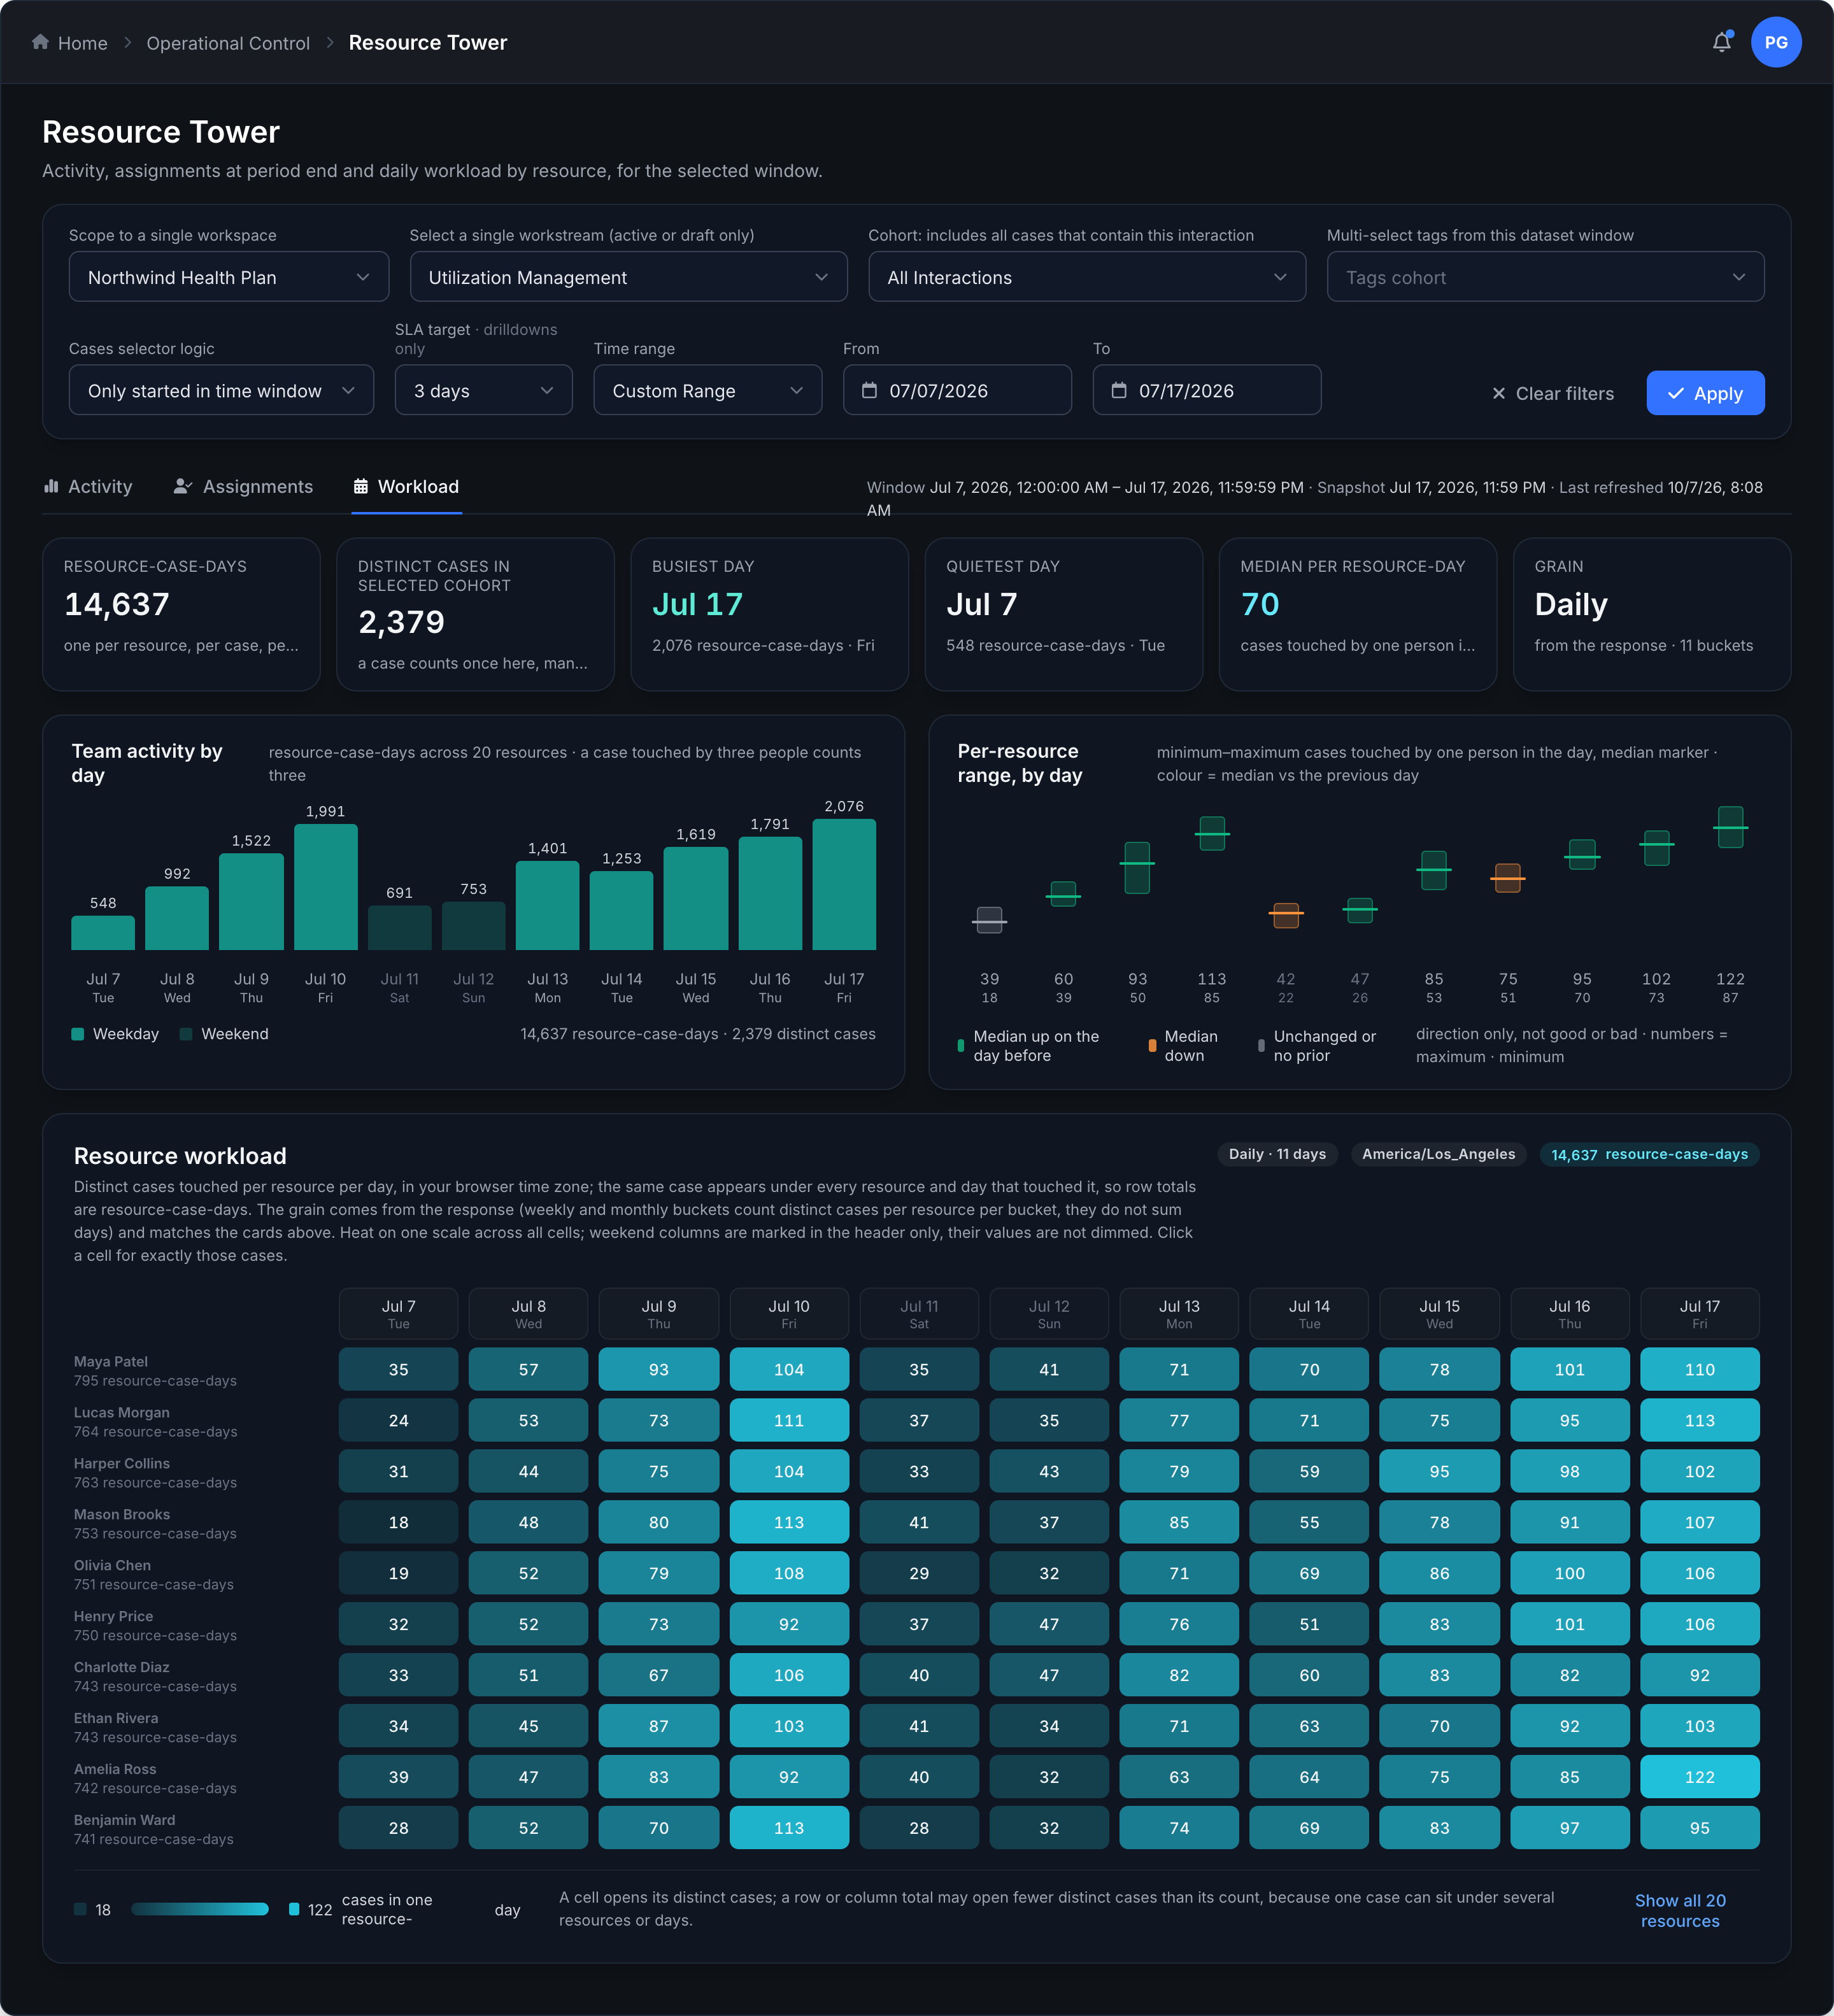
See How Workload Distributes Across Your Team
See daily case activity by resource. Spot uneven distribution, peak days and changing workload patterns.
Predict Risk Before It Becomes a Breach
An SLA clock shows how much time a case has used. Risk AI analyzes case history to predict which open cases are most likely to miss the deadline, giving your team an earlier signal and the evidence to act.
Go Beyond the SLA Clock
Where do cases stand against their SLA?
See breaches already recorded and cases approaching their SLA limit.
Which cases are likely to breach next?
Find cases whose workflow patterns point to a future breach, while there is still time to intervene.
Sample the Case History
Bring completed outcomes and open cases into the analysis to establish the workflow context.
Identify Risk Patterns
Find patterns in waiting, repeated work, state history and assignments that are associated with SLA failure.
Predict What Happens Next
Score eligible open cases and surface those most likely to miss their deadline.
Know Which Cases Need Attention Next
Move from workflow risk to a prioritized case list. See predicted breach probability, time remaining and the factors behind each flag, so your team can focus its follow-up.
Understand the Prediction. Examine the Evidence.
See which factors shape the risk assessment, then compare predicted risk with completed case outcomes. Your team can inspect the basis for a flag and the analysis behind it.
The Same Recorded Work. A Financial View.
Operational Control shows where work stands, who owns it, and what needs attention. Workflow Economics uses the same recorded activity with agreed prices to build cost models, compare assumptions, set Case and workflow-step cost targets, and explain monthly modeled variance.
Stop Finding Problems in Last Month's Report
No pitch deck. No pressure. Just a conversation about what you're trying to solve and whether we're a fit.
- 30 minutes with our founding team
- Discovery, not a demo
- Honest assessment of fit